The Know-How-To-Earn Researched And Selected
VIDEO OF THE DAY For Your Info Viewing Pleasure
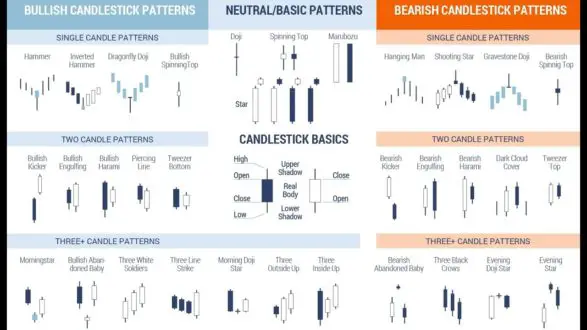
The ‘Learn How To Read Candlestick Charts’ Beginner Playlist
Candlestick Charts are a type of financial chart for tracking the movement of stock, crypto,
or forex securities. Each red or green candlestick represents a minute, hour, day, or month’s
worth of price data about the stock or currency. Eventually, the candlesticks will group into
recognizable patterns which investors can use to make their buying and selling decisions.
=> Stay Tuned: This Post Will Automatically Update With More News And/Or Info
Use The Playlist [If Available] To View Each New First And/Or Last Listed Video <=
The ULTIMATE Beginners Guide To Reading A Candlestick Chart
How To Read Stock Charts For Beginners (With Simple Examples)
The How To Read Cryptocurrency Charts Playlist
What Are Candlesticks And How To Read Them | FOREX 101
The Introduction To Technical Analysis For Beginners Playlist
[Video Of The Day is presented here each day that we find appropriately qualified Instructional,
Inspirational, Or Informational videos… Note: A video may, or may not, be posted every day.]
If you are not a pro or a guru yet; here are some highly recommended
legitimate resources which could be helpful to you... (A) learn to earn
(B) build business (C) earn your cash back (D) easy surveys for you
(E) everything you need to run your business for free